The job of a content marketer doesn’t stop when you hit ‘send’ or ‘post’. It begins there. You need to be measuring your content marketing metrics, so you can understand what works and what doesn’t – and so you can use those insights to build a constantly improving strategy.
An industry report showed that although 88% of organisations now use content marketing in one form or another, only 30% saw their efforts as effective and only 44% had any idea what ‘success’ looked like.
Businesses and marketers have attached to the idea that they need to be publishing content, which is good. But this has led to saturation, which is less good. Brands are creating more and more content, without necessarily creating more and more good content. And a big reason of this is because they aren’t measuring it.
Maybe it’s because the thought of producing a report creates a paralysing fear in people who are more naturally creative, maybe it’s because you just don’t know how to do it – what are you looking for and where do you find it?
So being the kind souls we are at addfolio, we’ve decided to run through your content metrics, how to measure them, and how to find what’s important for your brand.
WHAT CONTENT METRICS ARE IMPORTANT?
CONSUMPTION METRICS
This is where it all starts, and it’s what most marketers will already be familiar with. Consumption is a basic, but key, metric. It’s how many people are accessing your content and can provide a top-level overview of if your strategy is performing.
Regardless of your unique business goals, if nobody is seeing what you’re doing – it isn’t working.
The easiest way to track most of these metrics comes via Google Analytics.

Where you’ve got:
- Page Views, The most basic and easiest to understand metric is page views. How many people are looking at what you’re doing? Page views tells you how many of your pages, and which ones, are being looked at. Providing you with an easy visual of what’s performing well.
- Unique page views, If you want to delve a little deeper you’ll look at unique page views. Your page view metric tells you how many times a page is viewed, including if it’s viewed several times by the same user. On the one hand, this can create an artificially high page view number, on the other hand – it can show if your content keeps bringing people back and back again. But we’ll talk about this more later.
- Time on Page, So people are visiting your page. How long are they staying there? You might need to think about things dependent on your content here. If the avg. time on page for a 5,000 word blog is 30 seconds, chances are it isn’t being read. Equally, a 30 second time on page for a landing page intending to take a user deeper into the site might be exactly what you’re after.
These are some of your top level insights. They’re simple and easy to find and they can tell you if you’ve got an immediate issue.
This isn’t limited to Google Analytics. If you’ve been sending out an email, most email providers will give you an open rate and click through rate. On SlideShare or YouTube you have views. Whitepapers or other assets can show how many times they’ve been downloaded.
This data gives you a basic working/not working. If a page has a lot more views, do more of the same thing. If an email isn’t getting opened, something needs to change.
But even with these fairly top level metrics you can do more, to get some deeper insight.
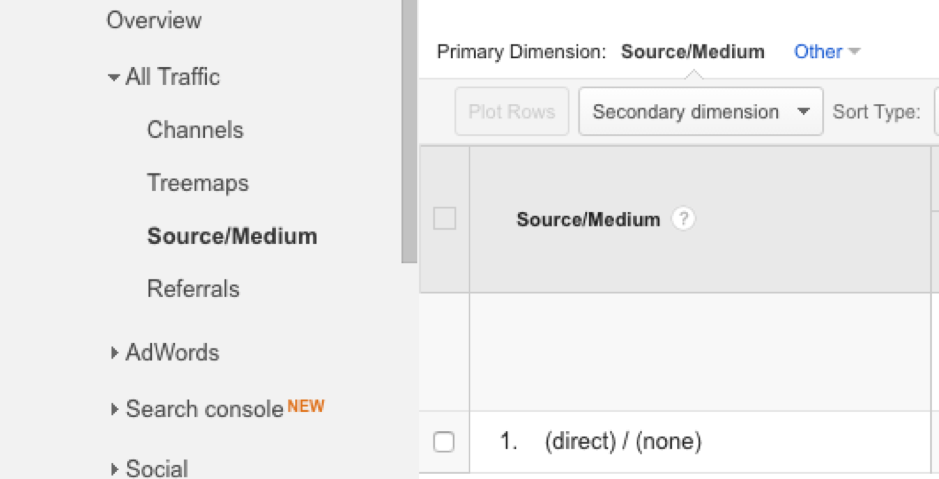
Let’s go back to our Google Analytics example. Click on that button marked ‘secondary dimension’ and navigate toAcquisition>Source/Medium.

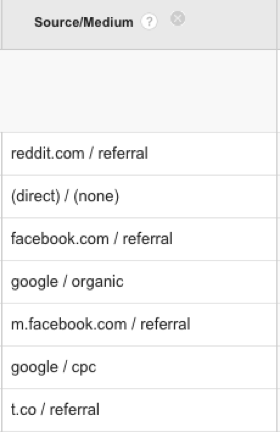
This will give you another column marked Source/Medium (oddly enough) which displays all the various where’s that your traffic comes from.

So what?
Using the above example, I’d see that my content performs best on Reddit and is weaker on twitter (t.co) and via PPC.
There’s a few things that I could take from this, from a business point of view I might recommend that we stop spending budget on paid promotion, as we’re getting a large amount of traffic from other sources (including organic).
From a content point of view however, I might see that Reddit is by far the biggest traffic driver and begin optimising more content for that audience, and in turn driving more traffic.
That’s the benefit of measuring your content. It gives you insights you simply wouldn’t have been able to get otherwise.
ENGAGEMENT METRICS
So you’ve got your views, people are looking at your content. But then what?
After you’ve looked at if your content is being consumed, you need to know if it’s being engaged with. Again, you can go back to Google Analytics for some of this data, for example pages per visit and bounce rate can tell you if content is engaging a user. Although a high bounce rate isn’t always a bad one.

Your holy grail for email marketing
On a mail client such as MailChimp, you have different metrics, which can tell you a similar story. Your opt-outs and unsubscribes are telling you that these particular individuals do not like the content you’re producing. However, this doesn’t necessarily mean going back to the drawing board when it comes to your email content. Make sure you take into account other aspects of email marketing before overhauling your strategy.
If you’re emailing people three times a day, maybe that’s why they’re unsubscribing. And if your subscriber list is still growing, a few unsubscribes isn’t the worst thing in the world.
Away from email content, one of the strongest metrics of content engagement is sharing. It’s fairly self-evident, but if a user shares a piece of content – it’s because they find it interesting or think sharing will reflect well on them. As well as simply getting more eyes on your content, sharing is a vote of confidence that it’s good – and the sort of thing a user wants to engage with.
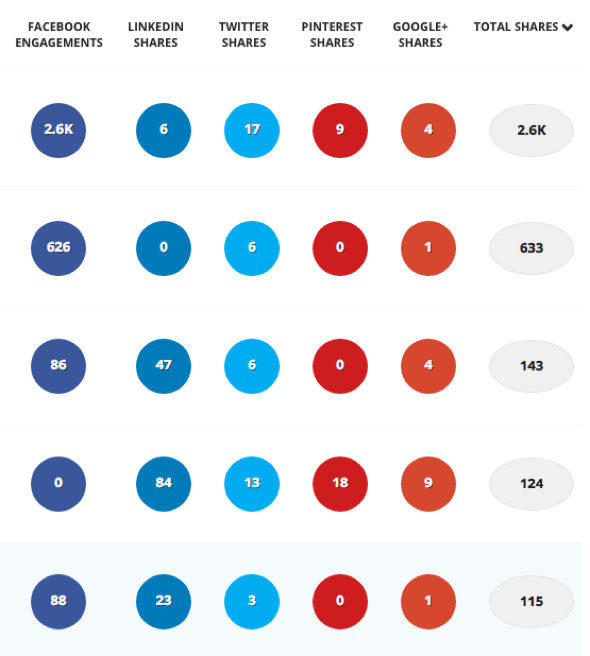
There’s plenty of monitoring available for social channels which makes finding out your engagement even easier. A service such as BuzzSumo collates all your shares across channels into an easy to digest format. Searching your domain will show you what content has picked up socially and what hasn’t.
As you’ve probably picked up, looking at metrics is about the intelligent application of data to inform strategy.

Pinterest probably isn’t your strongest channel.
In the above example, a basic assumption would be that every piece of content should follow the path of row 1 and it’s 2.6k shares. But what if you delved deeper and discovered that most of those shares resulted from getting ‘lucky’ and an influencer promoting the content to their userbase, or that the visibility came from a large amount of paid promotion?
As good as data is, you have to look at it intelligently. For example, the better insight might be if rows 3+4 were both long form articles around a certain topic – you now have a roadmap for producing shareable content on LinkedIn.
As you can see, engagement metrics show more than just consumption – and provide a more accurate segment of what works and – in the case of sharability – where it works. You’re understanding more about your user’s behaviour in terms of your content, and in turn – you can curate your content more to their preferences.
OTHER METRICS
This article isn’t going to talk about conversion metrics. On the one hand – they’re the metric most directly tied to business performance, and they can feel less ‘wishy-washy’ than things like shares (or likes). But on the other hand, they can often be effected by a litany of other aspects – some of which you might not have control over as a content marketer. For example, your product page content might be top-notch, compelling and convincing, but if the price point is wrong – the user will never convert.
Of course, intelligent goal completion and e-commerce monitoring can be set up to measure your content, but that’s for another blog. Instead, here we’re going to talk about those ‘other’ metrics – the ones that you have to think a little more diagonally about.
Content undoubtedly has an effect on brand. If you consistently produce quality content, you’ll become an authority in your industry. But how to measure it?
Brand is often used by lazy content marketers as an example of something that can’t be measured. However – this couldn’t be further from the truth – you can quantify your businesses’ brand growing over time.
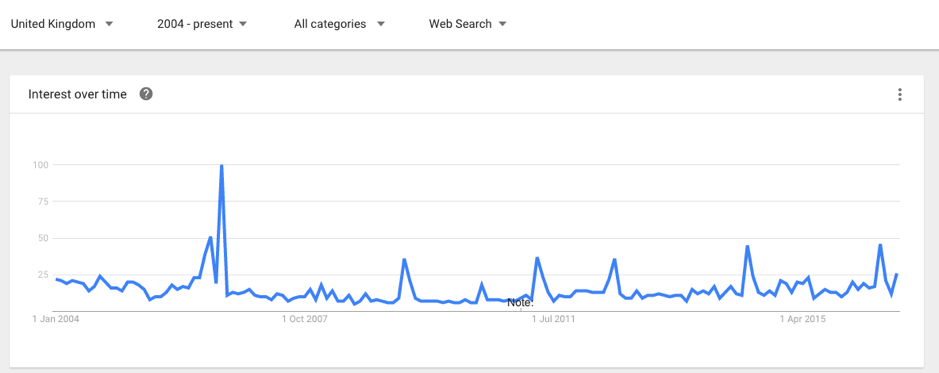
Well, an effective measure of Brand recall is by tracking your brand over time on Google trends. With data stretching back to 2004 you should be able to see how your brand develops over time. With filters for location you can even track how you develop as you emerge into new markets.

Alternatively, you can go into old reliant Google Analytics and filter your traffic acquisition by Source/Medium (direct) / (none). If people are typing your URL directly into the address bar, chances are this is due to familiarity with your brand. If over time you’re seeing a slow increase in your direct traffic – this is indicative of your brand increasing over time.

Away from building your brand, another alternative metric for your content is to look at how many links you’ve built.
Often link building is the result of solid outreach campaigns, but you never know – you might have produced a sensationally solid piece of content that people can’t help but link towards. Earlier we mentioned how sharing a piece of content was an implicit endorsement – that’s doubly true of building a link. Which also has the added benefits of contributing to your site’s authority in the eyes of search engines.
There’s plenty of services out there which are able to monitor your backlink profile. However, most of the functionality you’ll need can be found on Majestic.

You are able to search sub-domains, URL paths or specific URLs to find backlinks. If you’re looking for a specific web page – just plug in that URL into the site explorer and filter to search ‘url’ on the drop-down. This will pull all links pointing towards that page and in addition you’ll also be able to see the ‘quality’ of those links.
As we’ve mentioned throughout this article – this isn’t about measuring for the sake of measuring. As content marketers you should be looking to optimise your strategy constantly, your metrics provide you a way to do this.
For example, if you’re a travel company and you notice that your city guides regularly pick up a few links from smaller bloggers, this gives you an insight. You could reach out to these bloggers for their ideas on how you could improve your content output, you could liaise with them over social channels to boost the reach of your pieces or you could work together with them to create more curated content.
It’s about going beyond the data and numbers to provide yourself with actionable, and beneficial, insights.
FINDING YOUR METRIC
All metrics are not made equal. For some businesses measuring certain metrics might be pointless. If you’re in a saturated niche industry, it might be nearly impossible to make a jump in your page views – but looking at engagement metrics might prove whether your content works. Equally, some businesses will be all about lead generation, while others won’t care about it.
Most of the above should be fairly common sense to your unique business proposition, but you should still have a large resource of metrics to look at. The best approach to take can be going broad, then deep – capture as many metrics as you can, you’ll quickly realise what works and doesn’t work for your brand. Note: this doesn’t mean ignoring metrics where you don’t perform well, if anything you should be focusing on these.
Once you’ve gone broad and identified where your metrics are, it’s time to go deep. It isn’t enough to look at metric x and go “this is good/bad”. Instead, you need to delve deeper – it’s where you find the insights that can inform your content.
So instead of just going, this blog has a low time on page, it’s a bad topic – you could look at the page itself and notice that a lot of contextual links are present in the opening paragraph – navigating people away before they’ve engaged. If you tested spreading out those links you might notice an increase in that time on page. It’s a minor amend that benefits your content that you might not have noticed without looking at your metrics.
That’s really what it’s all about – it’s not about giving yourself data which makes you look better when you present to directors (well, it’s a bit about that) – it’s about creating a process which improves your content over time.


